According to Yahoo, the global big data and analytics market was $41.39 billion in 2022, and is expected to skyrocket to $346.33 Billion by 2030. Augmented Analytics is forthcoming too, and will be one of the fundamental factors driving that growth. It’s true that data analytics methods always change. For now, or at least until the next analytics breakthrough, ultrawide screens offer great advantages for data analytics.
All four phases of data analytics: descriptive, diagnostic, predictive, and prescriptive require one common thing – efficiency. All of them do benefit from an ultrawide monitor. However, especially for descriptive and diagnostic data analytics, the way you interpret the data matters a lot. Unlike predictive analytics, where less manual intervention is needed, descriptive and diagnostic analytics requires analyzing data from multiple angles.
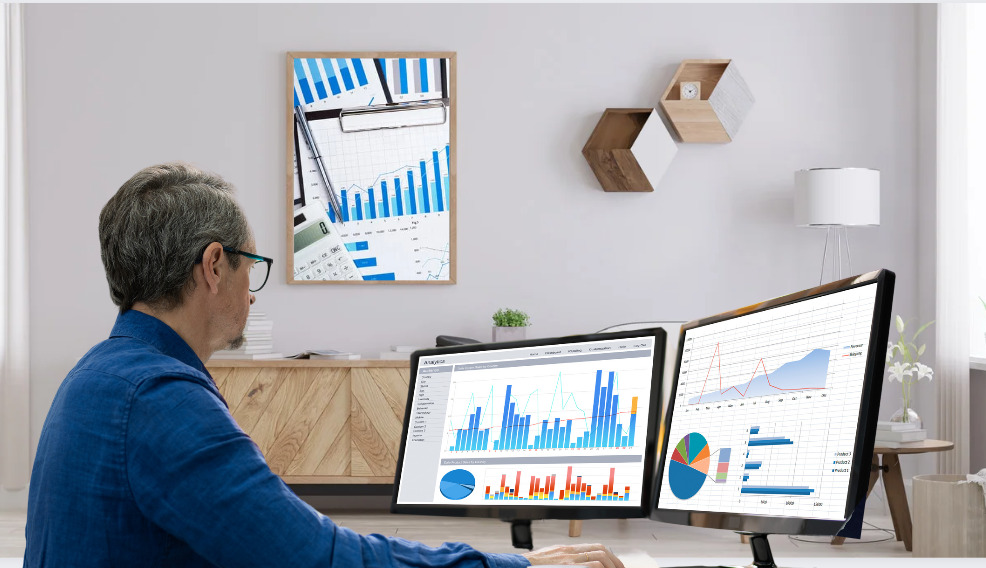
Now, it’s obvious that more screen area is better for data analytics. And for a larger screen, you can only increase a monitor’s width, not its height, as your viewable area. That’s why ultrawide screens are ideal for data analytics. Ultrawide monitors are a much better way to achieve an ultrawide screen, I mean, than this traditional data analytics setup:
Here are the benefits of an ultrawide screen for data analytics, given the greater viewable screen area it offers:
The Way you interact with the Data
At a glance, it may seem like an ultrawide monitor makes it easier to interact with data, nothing else. However, the way you interact with the data is one of the most important aspects of data analytics. And it is greatly improved too by using an ultrawide screen. Not only is it faster, but it also helps you to see and interact with the data patterns more clearly. Using an ultrawide screen, you require fewer scrolling and switching between tabs. It also allows you to work on multiple tasks or windows simultaneously. You can keep one window open for analyzing data and another window open for creating reports. In addition, an ultrawide monitor can run multiple windows side-by-side, so you can compare data more effectively.
The Way you Visualize the Data
Given the rate at which visual information is processed, the use of quality infographics is 30x more likely to be read than plain text. Ultrawide screens offer a great advantage here, as they support wider resolutions. This not only makes data visualization easier but also allows for the simultaneous display of multiple data points. You can easily view multiple charts and graphs at the same time, and compare them. After all, you’re a human being. Better graphics and visuals do attract your attention more than a bunch of numbers. Due to the 21:9 aspect ratio of an ultrawide monitor, you can visualize data in a way that’s more appealing.
For example, you can use a timeline chart on the left and view the data chart on the right – all on the same screen. And both the screens are as good as a normal monitor and a half each! In fact, you can also use the extra space to add more elements to the visualization. Good visualization leads to a better understanding of the data.
Finding the Insights
In data analytics, there are a lot of insights you may miss if you don’t have enough screen space. For example, if you’re working with a spreadsheet that has five columns, you might find it difficult to view the entire spreadsheet on a normal monitor. Another example is if you’re working with a map. You need to zoom in and out a lot to get a clear view of the data. An ultrawide monitor offers the perfect solution for this.
Technical analysis of the financial market is also a form of data analytics. If you are a trader, spotting insights like hidden candlestick patterns are invaluable. On an ultrawide screen, you can see the entire trading chart. See the illustration below of the same trading chart; one is on a normal monitor, another on an ultrawide monitor:
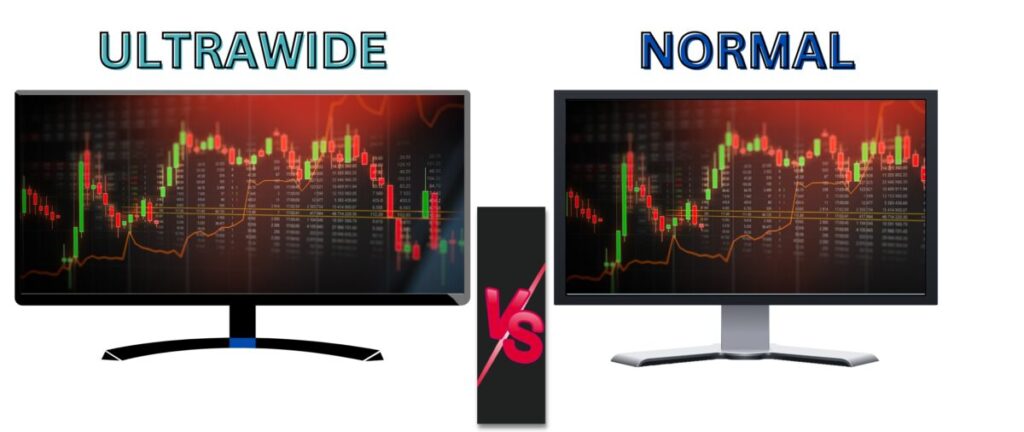
You can clearly see how much you might be missing with a normal monitor! In the example above, at least 20 candles are hidden in the normal 16:9 monitor compared to a 21:9 ultrawide.
Saves a Lot of Time

Many professionals have stated that data analytics is a stressful career. A fair portion of that is attributed to the time-consuming nature of the job. Using an ultrawide monitor saves data analysts a lot of time and stress. Generally, it takes more time to analyze data and create meaningful insights on a 16:9 monitor. For example, if you want to compare two data sets, you would have to switch between the two windows on a monitor, which can take time. Furthermore, moving your cursor from one window to another can also be tiresome. In fact, if you are working on a large project, it can be time-consuming and tedious. That is especially if the project is about data mining. An ultrawide monitor makes navigation faster and saves time.
Also, one thing to note here is that you are not paying the price of accuracy; with an ultrawide monitor, it’s faster yet more accurate.
The Nature of Data Analytics Software Tools
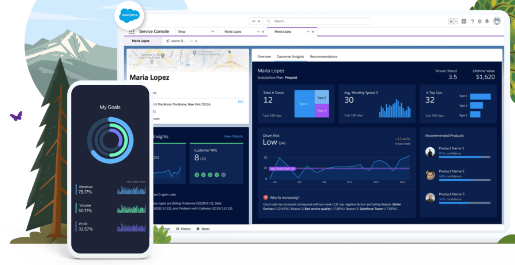
The nature of current data analytics software tools demands considerable screen space. Working with multiple tabs, windows, and tools becomes inconvenient on regular-sized screens. And for any data analytics professional, all those tasks are often simultaneous. For example, running queries, reviewing results, visualizing data, and creating reports. Especially the data analytics software like Tableau and Power BI, which are used to create interactive reports and dashboards, require vast screen estate. The nature of the current data analytics tools is also about a lot of number crunching. And an ultrawide monitor helps you to view more cells, rows, and columns of the data at one time.
Recommended related post: Best Ultrawide Monitors for Each Purpose
Bottom Line
The way an ultrawide screen makes data analytics better, faster, and more accurate provides a great edge. From traders to data miners, and from statisticians to data scientists, all should use an ultrawide monitor for data analytics. In some cases, though, a 21:9 screen may not be enough, like if big data analytics is the job. Even then, rather than using 2×16:9 monitors, there are 32:9 ultrawide monitors available for a cleaner and more efficient setup.
Brit strictly hates when someone says "the future". She considers herself a futurist and believes that there is no such thing as future yet.
Latest posts by Britney Foster (see all)